Graphs
Graph objects for both bar and pie charts are included in the toolbox, even though their appearance is interchangeable.
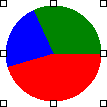
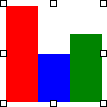
Each segment of a Graph is assigned to data. Bar graphs take the largest segment as the designed height, then allocate other segments proportional to the largest. Pie charts sum segment values, then allocate segments based on their proportion of the whole.
Adding Graphs
Toolbox members Bar Graph and Pie Chart are selected and dragged to the form area to generate new graphs.

Segments are linked to the system variable Document, Job Page Current and should be relinked to the required data fields.
Appearance and Properties
 Size handles show when
  is highlighted, pull any
white square handle to resize. Holding down Shift when
pulling a corner handle keeps the same aspect ratio.
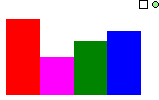 Rotate handle shows when
  is highlighted, rotate
by pressing and holding mouse-left when positioned over the green
circle.
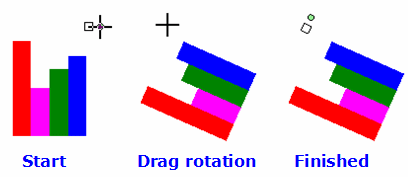 Rotate
handle
  shows while rotating; graph is placed, rotated when mouse-left is
released.
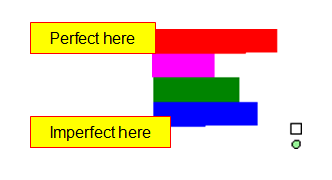 Holding
down Ctrl rounds the rotation to steps of 7.5°. This allows
easy selection of 90° angles. Without Ctrl, "near misses"
are possible.
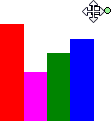 Move graphs by selecting the square box with mouse left, then
moving until mouse left is released.
On Screen Icons
![]() Pressing Mouse Right with a graph selected shows an on-screen
menu of icons, at the position of the cursor. These act identically
to the top menu icons.
Pressing Mouse Right with a graph selected shows an on-screen
menu of icons, at the position of the cursor. These act identically
to the top menu icons.

 Bar Graph
  and Pie Chart
  change representation
with the new version occupying the same area as the old. These are
the same graph.
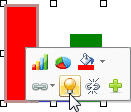
Remaining icons are for one segments of the graph. Select one segment which highlights. If the graph is re-selected, the selected segment remains highlighted. These are the individual icons and their impacts:
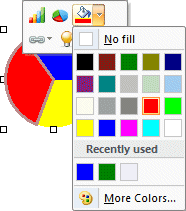
Segment Color allows color selection using the normal tools.
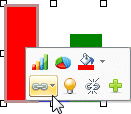
Link segment open a list of fields, select one (which should be numeric and may be a derived value from a formula). See next.
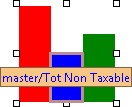
Data source shows the name of the source field from which this segment is derived (as well as for all other objects).
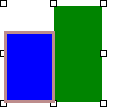
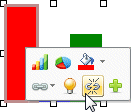
Unlink removes current segment from the graph. The remaining graph segments expand to fill the same area.
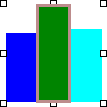
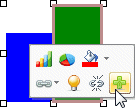
Add segment adds a new last segment. The same area now contains the additional segment. To add a segment anywhere else use the Properties windows.
Properties Window
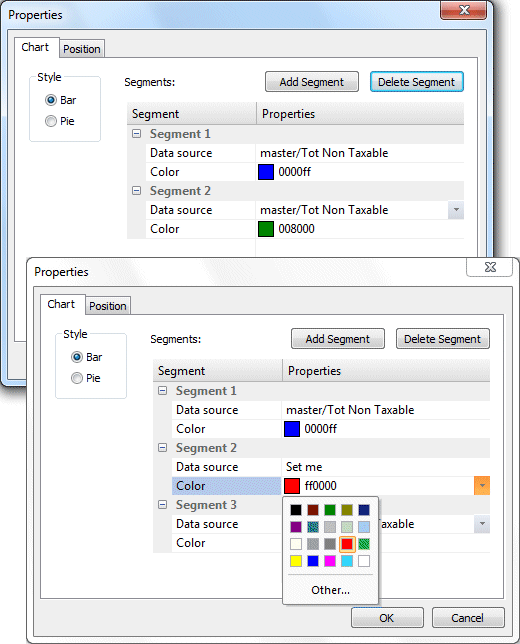
Properties icon ![]() opens the properties windows for Graph:
opens the properties windows for Graph:
Position allows entry of exact Location, Size (with or without aspect ratio control) and Angle.
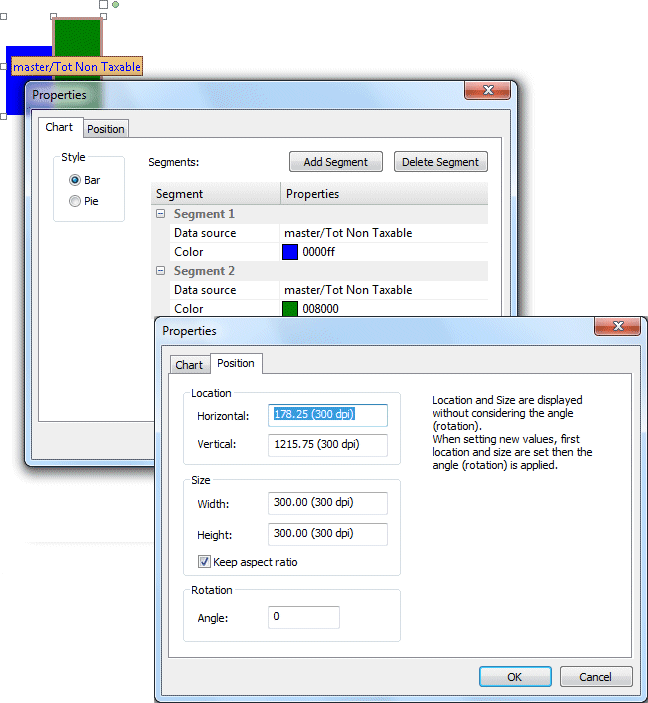
Chart allows graph Style selection.
Add Segment inserts a new segment (prior to the current segment). Pull-downs are present for for segment color and source field.
Delete Segment removes the current segment.
